World motor vehicle production
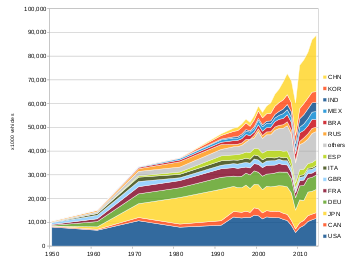
By yearedit
| Year | Production | Change | Source |
|---|---|---|---|
| 1997 | 54,434,000 | — | |
| 1998 | 52,987,000 |  2.7% 2.7%
|
|
| 1999 | 56,258,892 |  6.2% 6.2%
|
|
| 2000 | 58,374,162 | 3.8%
|
|
| 2001 | 56,304,925 | 3.5%
|
|
| 2002 | 58,994,318 | 4.8%
|
|
| 2003 | 60,663,225 | 2.8%
|
|
| 2004 | 64,496,220 | 6.3%
|
|
| 2005 | 66,482,439 | 3.1%
|
|
| 2006 | 69,222,975 | 4.1%
|
|
| 2007 | 73,266,061 | 5.8%
|
|
| 2008 | 70,520,493 | 3.7%
|
|
| 2009 | 61,791,868 | 12.4%
|
|
| 2010 | 77,857,705 | 26.0%
|
|
| 2011 | 79,989,155 | 3.1%
|
|
| 2012 | 84,141,209 | 5.3%
|
|
| 2013 | 87,300,115 | 3.7%
|
|
| 2014 | 89,747,430 | 2.6%
|
|
| 2015 | 90,086,346 | 0.4%
|
|
| 2016 | 94,976,569 | 4.5%
|
|
| 2017 | 97,302,534 | 2.36%
|
|
| 2018 | 95,634,593 | 1.71%
|
|
| 2019 | 91,786,861 | 5.2%
|
By countryedit
The OICA counts over 50 countries which assemble, manufacture or disseminate automobiles. Of that figure, only 14 countries (boldfaced in the list below) currently possess the capability to design original production automobiles from the ground up.
| Country | Motor vehicle production (units) | ||||||||
|---|---|---|---|---|---|---|---|---|---|
| China | 27,809,196
| ||||||||
| United States | 11,314,705
| ||||||||
| Japan | 9,728,528
| ||||||||
| India | 5,174,645
| ||||||||
| Germany | 5,120,409
| ||||||||
| Mexico | 4,100,525
| ||||||||
| South Korea | 4,028,834
| ||||||||
| Brazil | 2,879,809
| ||||||||
| Spain | 2,819,565
| ||||||||
| France | 2,270,000
| ||||||||
| Thailand | 2,167,694
| ||||||||
| Canada | 2,020,840
| ||||||||
| Russia | 1,767,674
| ||||||||
| United Kingdom | 1,604,328
| ||||||||
| Turkey | 1,550,150
| ||||||||
| Czech Republic | 1,345,041
| ||||||||
| Indonesia | 1,343,714
| ||||||||
| Iran | 1,095,526
| ||||||||
| Slovakia | 1,090,000
| ||||||||
| Italy | 1,060,068
| ||||||||
|
"Production Statistics". OICA. | |||||||||
By manufactureredit
This is a list of the 15 largest manufacturers by production volume in 2017, according to OICA.
| Rank | Group | Country | Vehicles |
|---|---|---|---|
| 1 | Toyota | Japan | 10,466,051 |
| 2 | Volkswagen Group | Germany | 10,382,334 |
| 3 | Hyundai | South Korea | 7,218,391 |
| 4 | General Motors | United States | 6,856,880 |
| 5 | Ford | United States | 6,386,818 |
| 6 | Nissan | Japan | 5,769,277 |
| 7 | Honda | Japan | 5,236,842 |
| 8 | Fiat Chrysler Automobiles | Italy / United States | 4,600,847 |
| 9 | Renault | France | 4,153,589 |
| 10 | PSA | France | 3,649,742 |
| 11 | Suzuki | Japan | 3,302,336 |
| 12 | SAIC | China | 2,866,913 |
| 13 | Daimler | Germany | 2,549,142 |
| 14 | BMW | Germany | 2,505,741 |
| 15 | Geely | China | 1,950,382 |
By market segmentedit
 | This section needs expansion. You can help by adding to it. (April 2019) |

Comments
Post a Comment